Apache ECharts is a powerful, interactive charting and data visualization library for browser
Apache License 2.0TypeScriptREADME
19.5K
2.4K
55.9K
6 months ago
11 years
plotly.js
Open-source JavaScript charting library behind Plotly and Dash
MIT LicenseJavaScriptREADME
1.8K
1.5K
15.9K
6 months ago
8 years
charts
Simple, responsive, modern SVG Charts with zero dependencies
MIT LicenseJavaScriptREADME
758
140
14.8K
8 months ago
6 years
apexcharts.js
📊 Interactive JavaScript Charts built on SVG
MIT LicenseJavaScriptREADME
1.2K
288
12.7K
6 months ago
5 years
G2
📊 A concise and progressive visualization grammar.
MIT LicenseTypeScriptREADME
1.5K
210
11.7K
6 months ago
8 years
highcharts
Highcharts JS, the JavaScript charting framework
OtherTypeScriptREADME
3.3K
1.2K
11.4K
6 months ago
14 years
vega
A visualization grammar.
BSD 3-Clause "New" or "Revised" LicenseJavaScriptREADME
1.5K
451
10.5K
6 months ago
11 years
G6
♾ A Graph Visualization Framework in JavaScript
MIT LicenseTypeScriptREADME
1.2K
357
10.1K
6 months ago
7 years
c3
📊 A D3-based reusable chart library
MIT LicenseJavaScriptREADME
1.4K
781
9.3K
6 months ago
11 years
uPlot
📈 A small, fast chart for time series, lines, areas, ohlc & bars
MIT LicenseJavaScriptREADME
350
85
8.0K
6 months ago
4 years
F2
📱📈An elegant, interactive and flexible charting library for mobile.
MIT LicenseTypeScriptREADME
661
237
7.8K
6 months ago
7 years
metrics-graphics
A library optimized for concise and principled data graphics and layouts.
TypeScriptREADME
514
131
7.5K
over 1 year ago
10 years
dc.js
Multi-Dimensional charting built to work natively with crossfilter rendered with d3.js
Apache License 2.0JavaScriptREADME
1.9K
408
7.4K
10 months ago
12 years
nvd3
A reusable charting library written in d3.js
OtherJavaScriptREADME
2.2K
567
7.2K
10 months ago
11 years
morris.js
Pretty time-series line graphs
CoffeeScriptREADME
1.3K
327
7.0K
over 2 years ago
12 years
lightweight-charts
Performant financial charts built with HTML5 canvas
Apache License 2.0TypeScriptREADME
1.3K
100
6.7K
6 months ago
5 years
rickshaw
JavaScript toolkit for creating interactive real-time graphs
MIT LicenseJavaScriptREADME
982
207
6.5K
10 months ago
12 years
roughViz
Reusable JavaScript library for creating sketchy/hand-drawn styled charts in the browser.
MIT LicenseJavaScriptREADME
218
33
6.5K
7 months ago
4 years
flot
Attractive JavaScript charts for jQuery
MIT LicenseJavaScriptREADME
1.6K
605
5.9K
6 months ago
13 years
billboard.js
📊 Re-usable, easy interface JavaScript chart library based on D3.js
MIT LicenseTypeScriptREADME
366
145
5.6K
6 months ago
7 years
epoch
A general purpose, real-time visualization library.
MIT LicenseHTMLREADME
294
71
5.0K
almost 5 years ago
11 years
cubism
Cubism.js: A JavaScript library for time series visualization.
OtherJavaScriptREADME
574
42
4.9K
10 months ago
12 years
peity
Progressive <svg> pie, donut, bar and line charts
MIT LicenseHTMLREADME
410
25
4.2K
almost 4 years ago
14 years
plot
A concise API for exploratory data visualization
ISC LicenseHTMLREADME
142
250
3.3K
6 months ago
3 years
dygraphs
Interactive visualizations of time series using JavaScript and the HTML canvas tag
OtherJavaScriptREADME
622
270
3.1K
7 months ago
14 years
plottable
📊 A library of modular chart components built on D3
MIT LicenseTypeScriptREADME
227
330
2.9K
6 months ago
10 years
dimple
An object-oriented API for business analytics
OtherJavaScriptREADME
573
145
2.7K
7 months ago
11 years
G2Plot
🍡 An interactive and responsive charting library
MIT LicenseTypeScriptREADME
598
322
2.4K
7 months ago
4 years
d4
A friendly reusable charts DSL for D3
MIT LicenseJavaScriptREADME
46
18
431
almost 4 years ago
10 years
AnyChart
AnyChart is a lightweight and robust JavaScript charting solution with great API and documentation. The chart types and unique features are numerous, the library works easily with any development stack.
OtherJavaScriptREADME
60
107
357
8 months ago
10 years
ZingChart
A declarative, efficient, and simple JavaScript library for building responsive charts
JavaScriptREADME
50
0
263
6 months ago
9 years
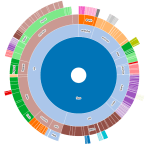
sunburst-chart
A sunburst interactive chart web component for visualizing hierarchical data
MIT LicenseJavaScriptREADME
78
47
256
9 months ago
6 years
funnel-graph-js
SVG Funnel Graph Javascript Library
MIT LicenseJavaScriptREADME
58
26
255
7 months ago
5 years
fusioncharts-dist
FusionCharts JavaScript Charting library. Over 95+ charts and 1,400+ maps to choose from, with integrations available for all popular JavaScript frameworks & back-end programming languages.
OtherJavaScriptREADME
46
34
75
over 1 year ago
7 years
circlepack-chart
A circle packing interactive chart web component for visualizing hierarchical data
MIT LicenseJavaScriptREADME
17
6
51
12 months ago
5 years
treemap-chart
A treemap interactive chart web component for visualizing hierarchical data
MIT LicenseJavaScriptREADME
10
8
48
12 months ago
5 years
chartist-js
Legacy Chartist Repo for old gh-pages
MIT LicenseJavaScriptREADME
15
5
46
8 months ago
10 years
icicle-chart
A partition / icicle interactive chart web component for visualizing hierarchical data
An open-source JavaScript library for world-class 3D globes and maps 🌎
Apache License 2.0JavaScriptREADME
3.3K
1.3K
10.7K
6 months ago
12 years
kepler.gl
Kepler.gl is a powerful open source geospatial analysis tool for large-scale data sets.
MIT LicenseTypeScriptREADME
1.6K
570
9.5K
6 months ago
6 years
tensorspace
Neural network 3D visualization framework, build interactive and intuitive model in browsers, support pre-trained deep learning models from TensorFlow, Keras, TensorFlow.js
Apache License 2.0JavaScriptREADME
440
27
4.9K
about 1 year ago
5 years
maptalks.js
A light and plugable JavaScript library for integrated 2D/3D maps.
BSD 3-Clause "New" or "Revised" LicenseJavaScriptREADME
486
223
4.0K
6 months ago
8 years
L7
🌎 Large-scale WebGL-powered Geospatial Data Visualization analysis engine
MIT LicenseTypeScriptREADME
528
108
3.1K
6 months ago
5 years
luma.gl
High-performance Toolkit for WebGL-based Data Visualization
OtherTypeScriptREADME
209
72
2.2K
6 months ago
8 years
giojs
🌏 A Declarative 3D Globe Data Visualization Library built with Three.js
Apache License 2.0JavaScriptREADME
241
12
1.6K
almost 3 years ago
6 years
globe.gl
UI component for Globe Data Visualization using ThreeJS/WebGL
MIT LicenseHTMLREADME
262
87
1.5K
6 months ago
5 years
streetscape.gl
Visualization framework for autonomy and robotics data encoded in XVIZ